Imagine opening a Bitcoin explorer and finding an address with an enormous balance. It looks like the home of a whale. Someone, somewhere, appears to have enough coins to make an entire market nervous.
Now imagine that address belongs to a custodian. Behind it are exchange customers, a fund, a family business and people whose savings fit comfortably inside an ordinary bank account.
The giant is a crowd.
Then turn the telescope around. One person can receive bitcoin at a new address repeatedly. The chain shows many destinations. The person has not become many people. Bitcoin's developer documentation actively encourages avoiding address reuse for privacy. Bitcoin developer guide
This is the difficulty hiding inside the deceptively simple question: who owns Bitcoin?
The network has a famous issuance limit, conventionally described as 21 million coins. What it does not contain is a global shareholder register. There is no column for a person's name, no mandatory declaration of nationality, and no field marked "institutional investor."
Those labels arrive from outside the blockchain. Sometimes they come with excellent evidence. Sometimes they arrive wearing more decimal places than the evidence deserves.
Follow one coin through the paperwork
Consider an exchange-traded Bitcoin fund. A saver buys its shares through a broker. The fund holds bitcoin. A specialist custodian safeguards it.
Ask who holds the shares, who owns the fund's assets, and who controls the signing process, and you have asked three different questions. A useful illustration is a warehouse: the operator responsible for the keys need not own the goods, and the person with an economic interest may never enter the building.
The distinctions are visible in a current primary document. The iShares Bitcoin Trust ETF's June 2026 filing says its shares represent beneficial interests in the trust's net assets. It identifies Coinbase Custody as the custodian safeguarding bitcoin owned by the trust. Those are separate roles. IBIT, June 2026 Form 10-Q
A chart can legitimately classify the coins under funds. A custody chart can classify the same coins under the service protecting them. Add the two totals together and the apparent supply grows without a single extra satoshi being mined.
The same trap appears when "institutional" becomes shorthand for "no ordinary people involved." A person buying a fund share can gain Bitcoin exposure while the underlying coins enter an institutional category. An institution can also hold bitcoin directly. The packaging alone does not reveal the people at the end of the ownership chain.
That leaves a more interesting possibility than the familiar story of whales swallowing everyone else: ownership can become easier to access at the same time that custody becomes more concentrated. Both deserve measurement. One chart cannot settle both questions.
Two large balances we can actually document
There are plenty of solid numbers. They become useful when each keeps its date and its meaning.
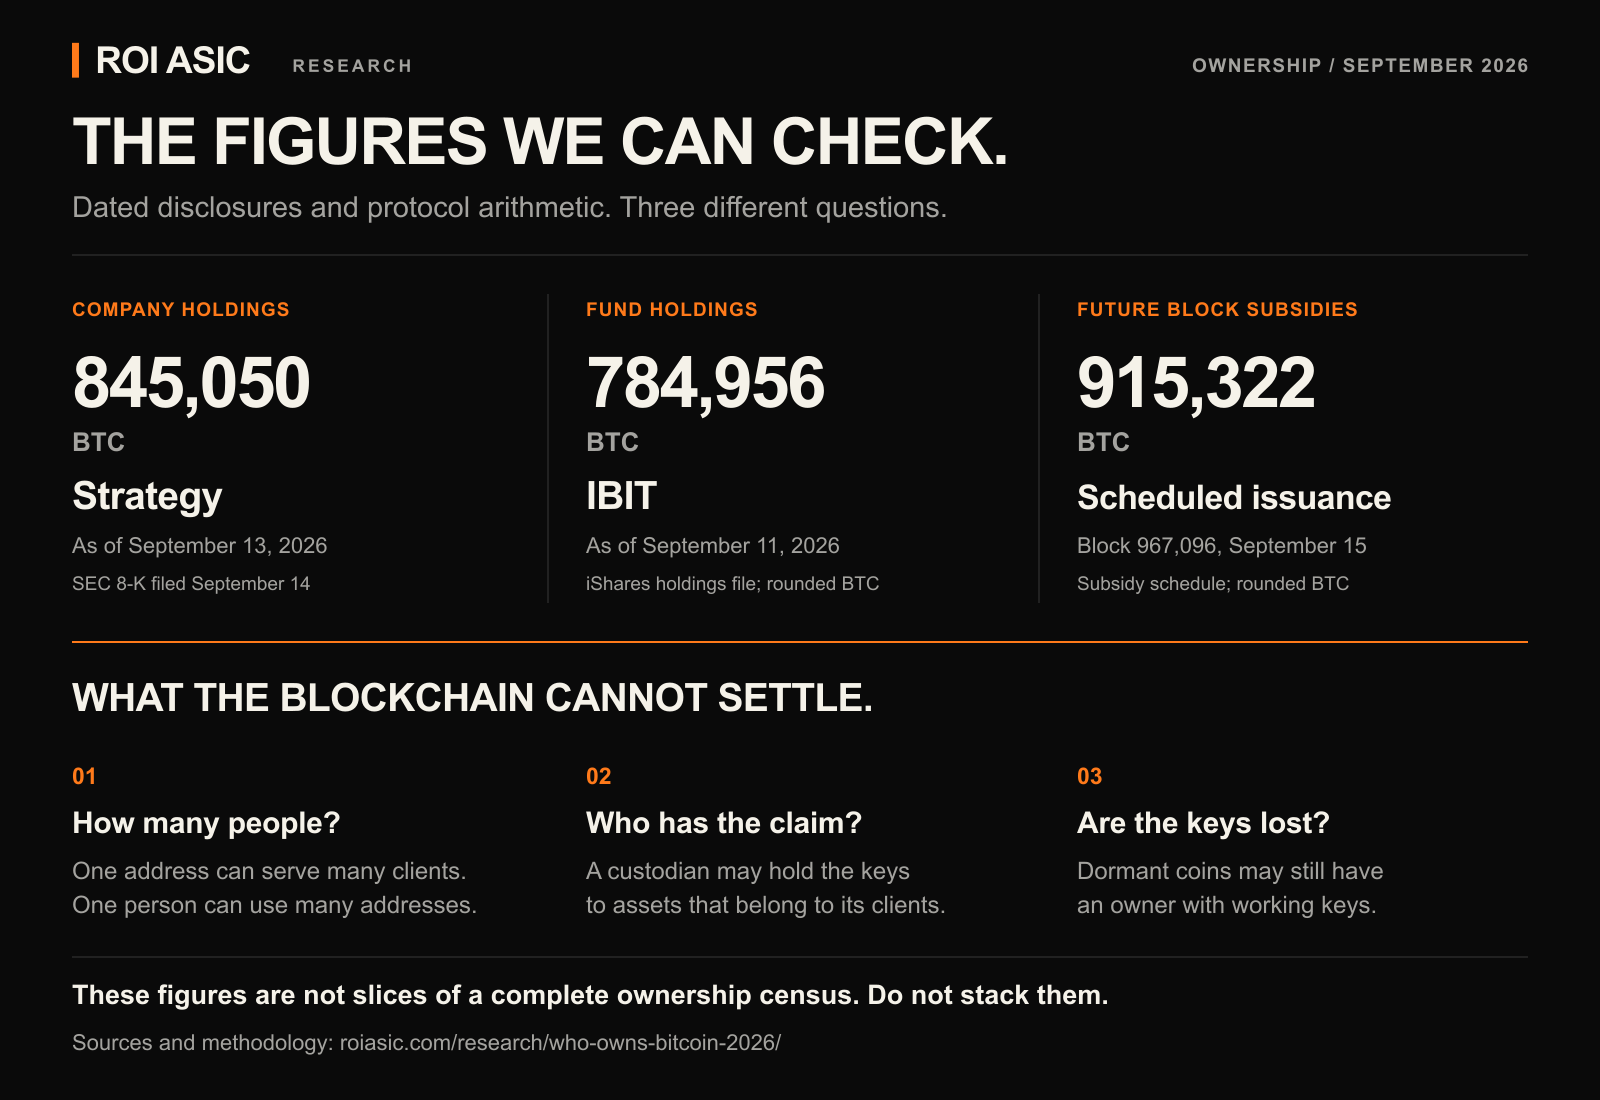
Strategy reported approximately 845,050 BTC as of 13 September 2026 in an SEC filing dated 14 September. The company also reported no bitcoin purchases or sales during 8-13 September. Against the conventional 21 million limit, that disclosed holding represents about 4.02%. Strategy, September 2026 Form 8-K
The official iShares holdings file available for this article reports 784,955.90260 BTC for IBIT as of 11 September 2026, or about 3.74% of the same limit. Its precision belongs to that dated fund record. It says nothing about how many ultimate investors hold the shares. iShares official holdings CSV
There is a small but revealing wrinkle. The fund's website already displayed net asset information dated 14 September, while the downloadable holdings file still carried 11 September. We retain the date inside the holdings file. A fresh-looking page does not make every number on it equally fresh. iShares fund page
These are two identifiable positions, with different structures and reporting dates. They are useful landmarks. They are not a complete census of the world.
What changed during the second quarter?
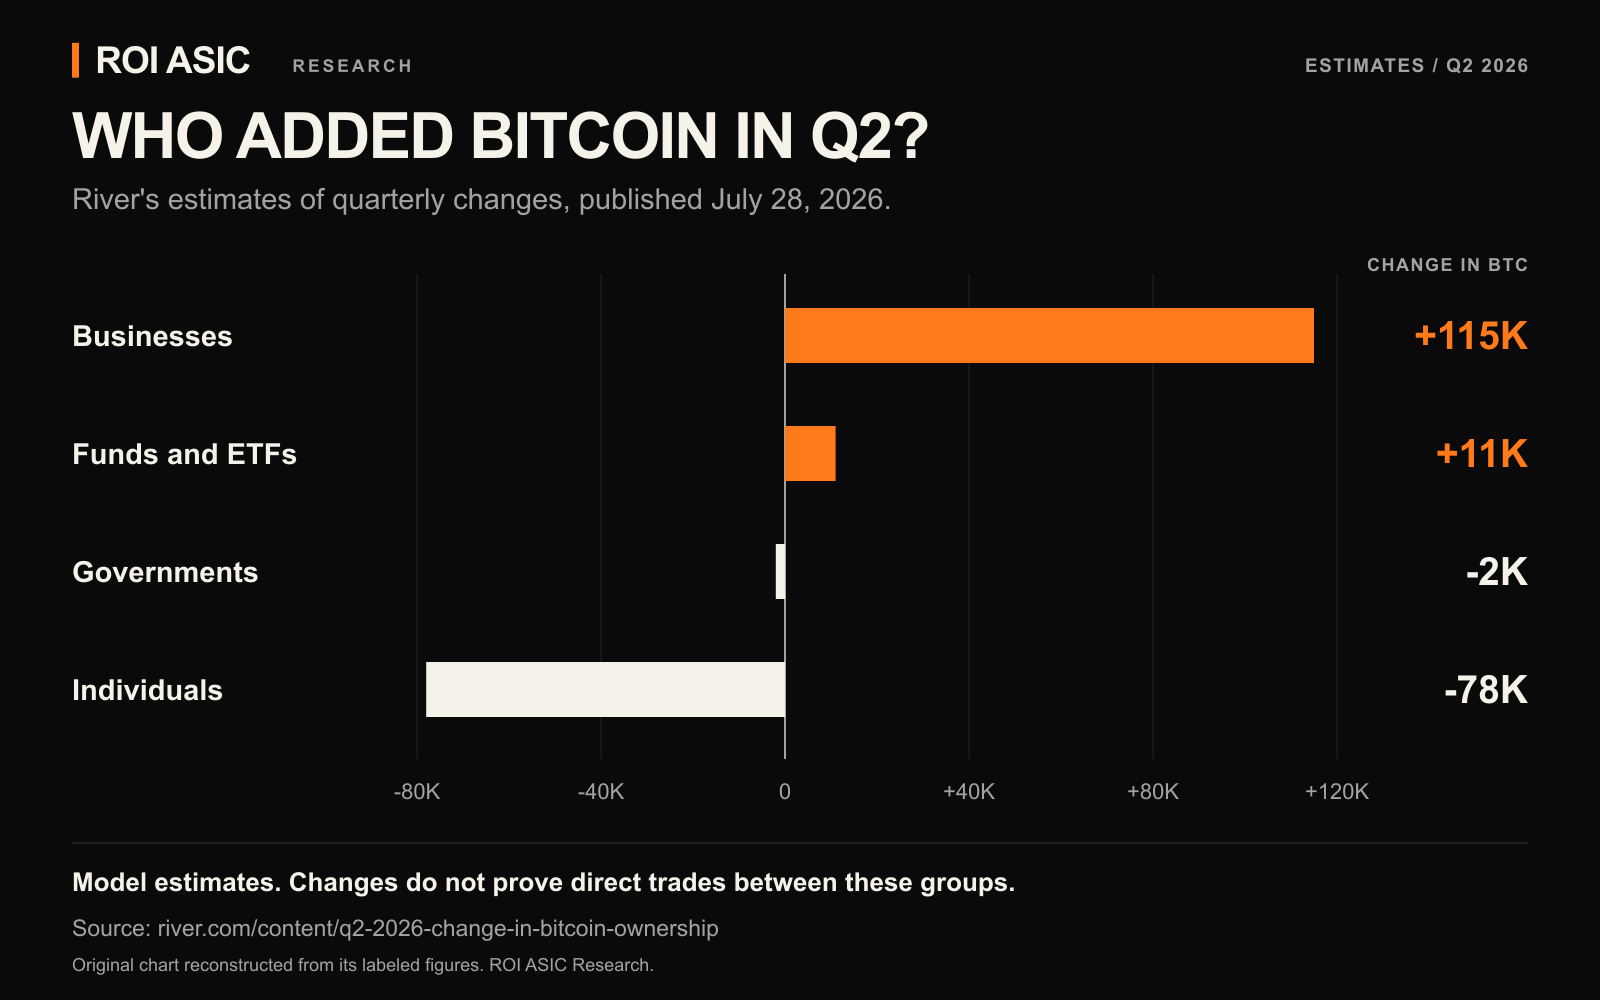
River's chart, published on 28 July 2026, estimates the following net changes for Q2:
| Category | Estimated change |
|---|---|
| Businesses | +115,000 BTC |
| Funds and ETFs | +11,000 BTC |
| Governments | -2,000 BTC |
| Individuals | -78,000 BTC |
The graphic credits River and BitcoinTreasuries. These are category estimates, not a list of identified trades. River's original Q2 chart
It is tempting to draw an arrow straight from the last row to the first. The table does not establish that route. A change between two estimated balances cannot identify the counterparties of every transaction in between. New issuance and the scope of the categories also matter when interpreting totals.
There is a good story here without inventing a villain or a procession of defeated sellers. Different kinds of participants were changing their positions. The task is to understand those changes without giving a category more personality than the evidence supplies.
The biggest slice may be the least directly observed
Suppose a chart starts with total supply, subtracts documented company holdings, funds, governments and a few estimated categories, then calls the remainder "individuals."
That remainder is an arithmetic result. It has not interviewed anyone.
If a previously unidentified corporate wallet becomes known tomorrow, part of the residual can move into the corporate category. The company might not have bought anything that day. The analyst simply learned something new.
This is why a tidy ownership chart needs a definition of its leftover slice. Does it mean verified private holders? All holdings not assigned elsewhere? Does it include unknown businesses, certain dormant balances or clients of intermediaries? Each choice answers a different question.
The test is simple: could the slice change because somebody discovered better information, even if nobody traded? If the answer is yes, the chart includes a model of ownership. That can still be valuable. Readers just need to know which part is measured and which part is inferred.
Silence does not tell us where the keys are
A coin that has not moved for years presents another temptation. A designer can colour it grey, call it lost, and make the rest of the pie feel scarcer.
But imagine two identical-looking addresses. One belongs to someone who carefully stored a backup and sees no reason to spend. The other belongs to someone who destroyed the only usable key. Their transaction histories can look the same. Their futures are very different.
Inactivity measures time since movement. It cannot, by itself, reveal whether a key remains available. Lost-coin estimates therefore depend on assumptions. A genuinely inaccessible coin and a coin whose owner is very patient should not silently become the same statistical object.
Even movement leaves questions open. A long-dormant holder might be changing a custody arrangement rather than selling. A transaction tells us that the spending conditions were satisfied. The human story still needs evidence.
The familiar "Satoshi" slice needs similar care. It relies on attribution of early activity, rather than a verified personal balance sheet. A responsible chart should name the attribution method and distinguish it from a disclosed corporate holding. It also needs to explain whether those coins overlap with a lost or dormant category.
That uncertainty fits Bitcoin's original design. Public transaction history and personal identity were deliberately separated in the white paper's privacy model. The visibility of the ledger was never a promise of a complete list of its users. Bitcoin white paper, section 10
The slice with an unusually clear rulebook
At the end of many ownership graphics is a small outlined segment: bitcoin still to be mined.
Here the evidence changes character. We can calculate future permitted issuance from block height and the subsidy rules, without guessing anyone's identity.
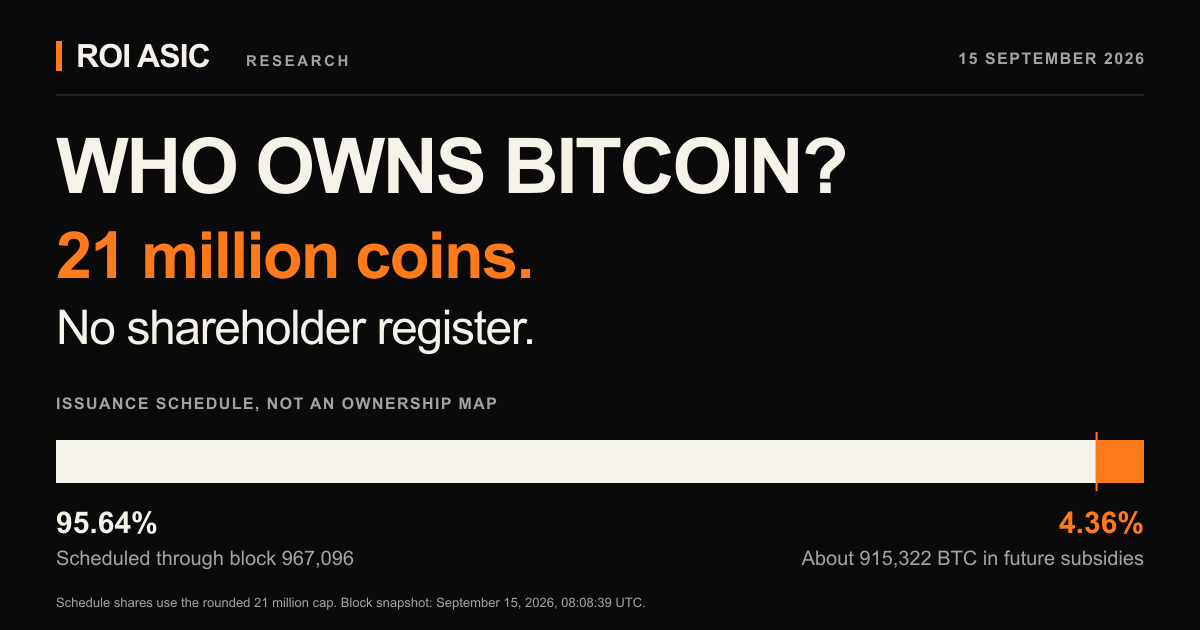
For this article we fixed the calculation at block 967,096, timestamped 15 September 2026 at 08:08:39 UTC. The remaining scheduled block subsidies total 915,321.8519 BTC. For a readable graphic, that becomes about 915,322 BTC, approximately 4.36% of the conventional 21 million limit. Block 967,096
The often-shared figure of 919,000 BTC is close. Measured against the rounded 21 million limit, it corresponds to block 965,919, timestamped 7 September 2026. It is consistent with an early-September snapshot. That validates the timing of this one figure, not the other ownership labels surrounding it. Block 965,919
There is no pile of unmined bitcoin sitting in a vault, reserved for whoever orders enough machines. The number describes issuance that the rules permit in future blocks. The units become claimable through valid block rewards as the chain advances.
Nor is this a measure of coins available to buy today. Existing holders can transfer existing bitcoin repeatedly. A small remaining issuance segment says nothing by itself about how much they will offer for sale.
Why more machines cannot empty that segment faster forever
The current block subsidy is 3.125 BTC. Bitcoin targets an average interval of roughly ten minutes, implying around 450 new BTC per day at that pace. Actual days vary because block discovery is probabilistic.
On the main network, difficulty normally adjusts every 2,016 blocks, working toward the target pace as mining power changes. Adding machines can make blocks arrive faster before adjustment, but it does not remove the mechanism that regulates issuance over time. Bitcoin developer guide: proof of work
The subsidy halves every 210,000 blocks. The next reduction occurs at height 1,050,000, when it falls to 1.5625 BTC. That is a block-height event. Its calendar date depends on how the chain progresses. Bitcoin Core subsidy function
For a mining operator, this turns an abstract scarcity graphic into something practical. The whole network competes for a limited stream of new issuance and transaction fees. A machine's contribution depends on the useful work it delivers, its share of competing hash power and the conditions under which it operates. Owning a box does not reserve a fraction of the remaining coins.
A Bitmain Antminer S21 is part of that competition. Its performance has to survive the ordinary realities of a site: power, temperature, downtime and the work a pool actually accepts. A spectacular ownership chart cannot tell an operator whether those conditions are under control.
It also cannot answer the long-term security question. Transaction fees can continue after new issuance ends. The code does not guarantee what users will pay, which businesses will remain viable, or how much mining power future fees will support. The white paper describes fees as an incentive that can continue without new issuance; the future economics remain a question to be answered by actual use. Bitcoin white paper, section 6
Read the small print before the biggest slice
The next time a chart claims to show who owns Bitcoin, look for three things before looking at its colours.
First, its date. A corporate filing, a fund download and a live blockchain height can all be accurate while describing different moments.
Second, its unit of observation. An address, an identified entity, a custodian and a beneficial investor are different units. A chart that changes units halfway through needs more than a confident headline.
Third, its treatment of uncertainty. Estimates should look like estimates. Residual categories should say what remains unclassified. Overlapping labels should not be stacked as if each contained a separate set of coins.
The result may be less satisfying than a perfect pie. It is more useful. We can see a large company, a large fund and a shrinking stream of future issuance clearly, while admitting that the full human ownership map remains incomplete.
Bitcoin lets us audit the rules of its supply more directly than we can audit the identities of everyone holding it. That is the revealing imbalance behind the chart.
The coins are countable. The crowd takes more work.
How we checked this
Financial snapshots use primary disclosures dated June 2026 or later. Each figure keeps its own reference date. River's Q2 figures remain attributed estimates. Examples of wallets and people are illustrative, not accounts of identified transactions. Protocol references describe rules rather than recent market measurements.
The future-issuance calculation sums permitted subsidies after block 967,096 with integer satoshi rounding. It does not estimate lost keys, tradable supply or actual historical rewards claimed. Percentage labels use the conventional 21 million denominator. The exact maximum of the scheduled subsidies is slightly lower because of rounding.
Continue with The Film We Will Never See. The Last Bitcoin We Will Never Mine. for the long timeline, or Your ASIC Has Three Hashrates for what an operator can measure today.